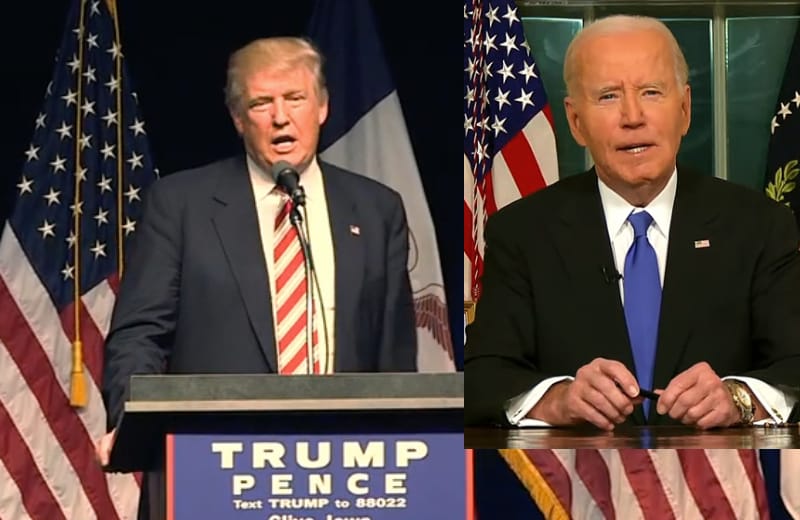
Trump vs Biden – Different Priorities
Manufacturing, incomes, and gas prices paint a clear picture of differing priorities. A real matchup of Trump vs. Biden shows quite a different picture to what the WHite House and media have been telling for the past four years.
Joe Biden’s presidency faces growing criticism over economic metrics that pale in comparison to Donald Trump’s record, with manufacturing jobs, household incomes, and gas prices at the forefront of the debate. As Biden nears the end of his term, Trump’s team asserts that Americans fared better under his administration – and the data backs up their claims.
Manufacturing Struggles Under Biden
The manufacturing sector declined sharply under Biden. Over 22,000 manufacturing jobs were lost when factoring in post-pandemic recovery and downward revisions. The sector saw one of its fastest contractions, with job openings plummeting 20.8% over the past year alone. In contrast, Trump’s first 38 months created 414,000 manufacturing jobs, demonstrating significant growth in this critical sector.

Gas Prices at Record Highs
Under Biden, gas prices averaged $3.49 per gallon, more than a dollar higher than Trump’s average of $2.48 per gallon. Nationwide, gas prices stayed above $3 per gallon for 92% of Biden’s presidency. While Trump’s term saw prices fall below $1 per gallon in 13 states, Biden’s administration saw record-high prices in all 50 states.
Household Incomes and Earnings
Americans saw a stark difference in household income growth under Trump and Biden. In Trump’s first three years, median household incomes grew by $7,690 – a 10.5% increase. By comparison, Biden’s term saw only a 1.3% increase, amounting to $1,050.
Minority groups experienced significantly higher income growth under Trump. Black Americans saw a 9.2% increase under Trump compared to 3.6% under Biden, while Hispanic Americans saw 11.7% growth under Trump versus just 0.2% under Biden. Asian Americans fared similarly, with Trump delivering a 14.4% boost compared to Biden’s 1.5%.
Earnings also shifted under the two presidents. Trump oversaw an 8.2% increase in real average weekly earnings, while Biden’s term saw a 3% decline. Women and men both faced earning losses under Biden after seeing increases under Trump.
Savings and Debt Tell a Grim Story
Under Trump, personal savings soared, with rates increasing from 5.3% in 2017 to 19.3% in 2021, a 264% rise. Under Biden, savings plummeted by 85%, falling to just 2.9% in 2024.
Credit card debt also surged under Biden, reaching a record $1.14 trillion – a 39% increase during his term. The credit card delinquency rate rose by 54%, in stark contrast to an 11% decline under Trump.
Home Ownership Declines Under Biden
The housing market presented challenges under Biden, with mortgage rates skyrocketing by 120%, reaching a 23-year high of 7.79%. By comparison, Trump’s tenure saw mortgage rates decrease by 32%. Homeownership increased by 2.1% under Trump but declined by 0.2% under Biden.
Poverty Reduction Slows
Trump’s presidency lifted 6.6 million Americans out of poverty in its first three years, with notable gains among Hispanic, Black, and Asian Americans. Biden’s term has struggled by comparison, lifting only 760,000 Americans out of poverty. Meanwhile, 330,000 Asian Americans and 370,000 Hispanic Americans fell into poverty under Biden.
A Choice for Voters
Trump’s economic policies prioritized growth, job creation, and lower costs, while Biden’s tenure has faced challenges such as rising inflation, higher gas prices, and declining savings. As Americans evaluate these contrasting records, the data underscores the profound impact of presidential policies on economic outcomes.
The Trump vs Biden comparison shows the official White House story over the past four years was colored by the need to tell a story that was different to reality. As bad as that is, much of the mainstream media proved to be an untrustworthy political pawn.


