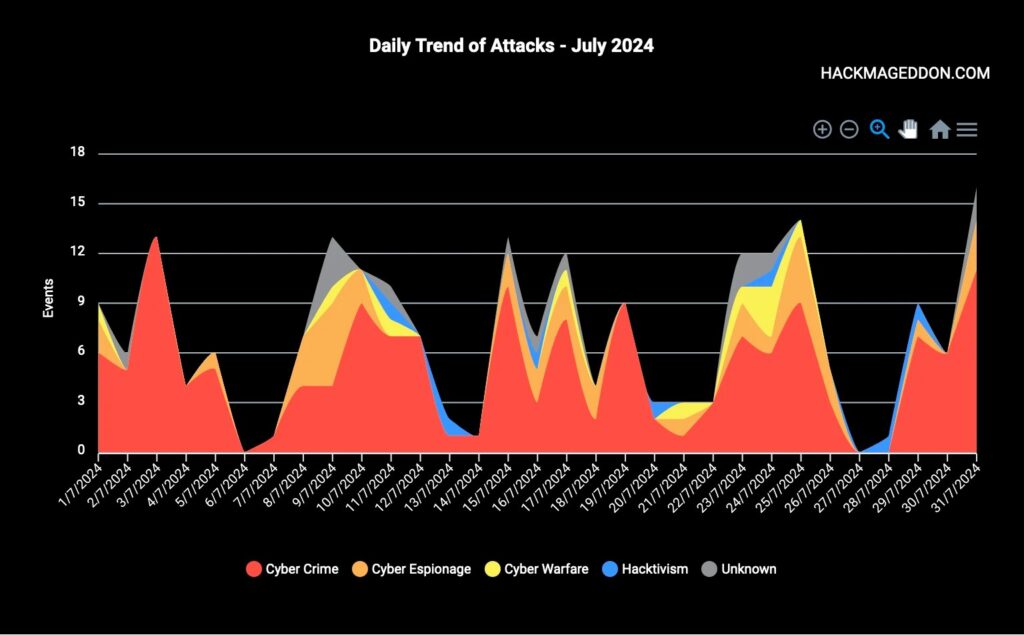
After the cyber attacks timelines (part I and part II), it’s time to publish the statistics for July 2024 where I collected and analyzed 219 events.
During July 2024 Cyber Crime continued to lead the Motivations with 70.3% in practice the same value of June and May when it was respectively 70.4% and 70.2%. Operations driven by Cyber Espionage ranked at number two jumping at 16% from 17.4% in June, ahead of Cyber Warfare still down to 4.6% from 5.2%, and Hacktivism closing the chart with a 3.2% up from 1.2% of the previous month.
Malware led the Attack Techniques with 23% up from 21.3% in June, followed by ransomware with 17.1% (it was 14.8% in June) and targeted attacks with 13.1%. As always, bear in mind that the high number of events whose attack vector is unknown, is due to the fact that in many cases, a ransomware attack is reported by the targeted organizations as a generic outage, without providing details of the incident.
The Distribution of Targets was led again by Multiple Organizations with 35.5%, essentially in line with June when the percentage was 35.7%, once again ahead of Individuals with 11.8% and slightly down from 12.2% in June. This month the third place was taken by organizations in the professional, scientific, and technical sectors with 8.6%.
Check out the interactive charts and the statistics, immediately after the infographic. And please support my work, sharing the content, and of course follow @paulsparrows on X (formerly Twitter,) or even connect on Linkedin, or Mastodon for the latest updates for the latest updates.


